Multi-region logging architecture with Logstash, Kibana, and ElasticSearch
25 Mar 2014 TweetBackground
On my team right now we are using rsyslog with Graylog2 and ElasticSearch to handle our logging infrastucture. The current setup is not ideal as we are distributed multi-region for our application in 3 datacenters (ORD, DFW, SYD) and each one has it’s own cluster setup to use Graylog2 and ElasticSearch. This means if someone wanted to search through logs you would have to pick that specific region’s Graylog2 instance. The original reason for this setup was that we had our logging infrastructure setup before multi-region was in place and we had to make a decision about how much time we wanted to spend setting it up. We chose for the quickest option as we had other product work that needed to get done before improving our logging infrastructure. This has proved to be a costly choice for us. Our current system has degraded to the point where we barely use our Graylog2 interface anymore. There are several reasons for this. One is that it is frustrating to switch between the multiple region interfaces and setup the same filters for each one. Another is that the version of Graylog2 + ElasticSearch we are working with are struggling to keep up with the amount of logs we have. It has gotten to the point where even simple queries executed on Graylog2 cause alerts to fire on our ElasticSearch cluster requiring action from us to help restore it.
Our backlog has some stories in place to remedy this situation, but are not on our radar for another few months. We recently had a hackweek and decided to experiment with some ideas and technology on what we want to use. Most of these ideas come from another team at Rackspace working on Autoscale. Our idea is slightly modified, but the same general concept. None of this is currently implemented in a production like environment and most of it was setup in a test environment to play around with during our hackweek. The technologies in play here are Logstash, Kibana, and ElasticSearch.
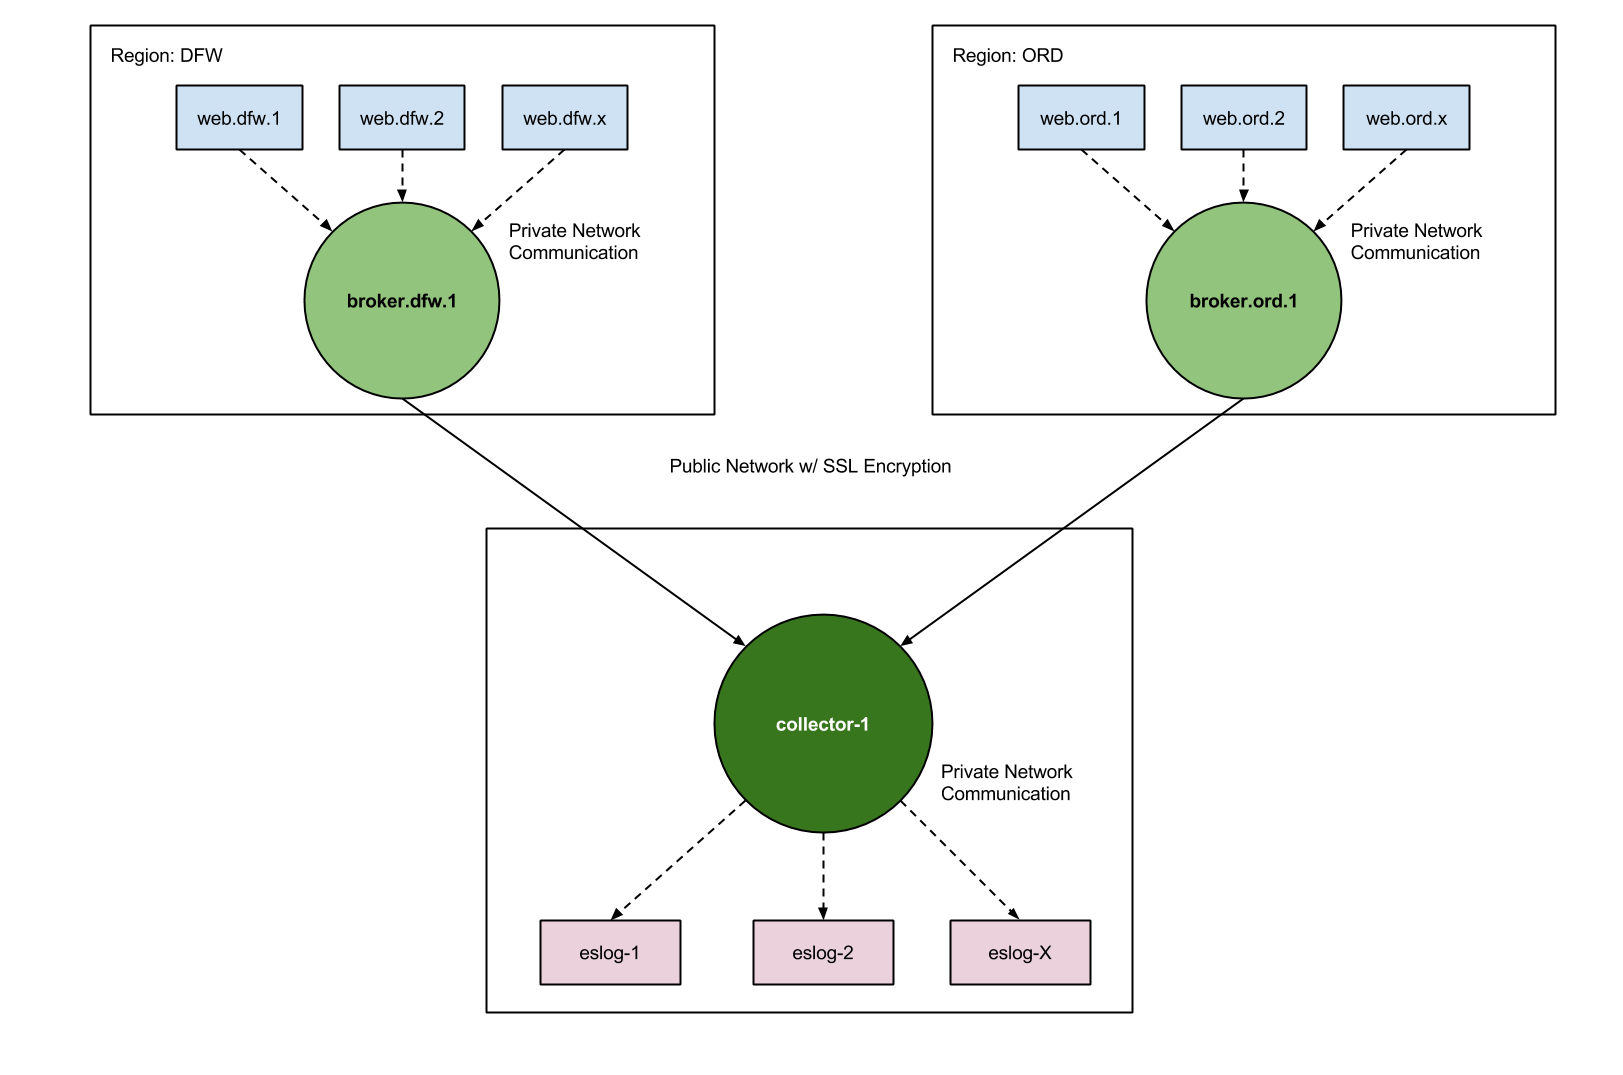
I have to explain our current architecture a little bit first to setup why we would use the solution proposed first. The Cloud Control Panel at Rackspace is hosted in three different datacenters, ORD (US and Europe), DFW (backup), and SYD (Oceanic). All of our US and European traffic goes to ORD, while our Oceanic traffic goes to SYD. DFW is left as a warm backup that is ready in case any issue happens in the other two DC’s. What we didn’t want to do was make the same mistake as before with our logging and have multiple regional interfaces to access our logs. This meant collecting all of our logs and putting it into one datacenter for searching and querying. What that required was having each datacenter ship their logs to the collector which then puts these logs into ElasticSearch. There exists a node in each datacenter, called the broker, which then ships to the collector the logs for that datacenter. So let’s go over this one more time. There is one collector node, one broker node per region shipping to the collector, and all nodes in the same datacenter ship nodes to their specified broker. We can then browse logs through our collector which will be running Kibana.
Hackweek
For the hackweek we broke up different portions of the infrastructure to different team members. I tackled setting up the broker node for a region and the collector. Having all nodes in the specified datacenter ship logs to the broker over a private network, which then in turn sent its logs to the collector on a public network over an encrypted channel. Our team already uses logstash for all of our nodes to send metrics to statsd, so most of the initial boostrapping of getting the logstash agent installed and running was already handled. We use Chef and Berkshelf to manage our infrastructure, which means we are using the logstash cookbook at version 0.7.6 at the time of this writing. Earlier versions of the cookbook had all the configuration rules for logstash written as node attributes which we put at the role level. As this method of creating rules was deprecated I moved them into configuration files that sit in the logstash conf.d directory. Logstash reads these config files in order, I found a convention I liked here about numbering each config file which I decided to follow.
To get all nodes in a specific datacenter to send their logs to the broker I decided to use tags to handle forwarding the logs I wanted. An example of what this would look like via config files would be the following
00_input_base.conf

input {
  file {
    'path' => '/var/log/rackspace-monitoring-agent.log',
    'type' => 'rackspace-monitoring-agent'
  }
}
01_input_apache.conf

input {
  file {
    'path' => '/var/log/apache2/error.log'
    'type' => 'apache-error'
    'tags' => ['broker']
  }
  file {
    'path' => '/var/log/apache2/access.log'
    'type' => 'apache-access'
    'tags' => ['broker']
  }
}
90_forward_to_broker.conf

output {
  if 'broker' in [tags] {
    redis {
      'host' => '192.168.9.1'
      'data_type' => 'list'
      'key' => 'logstash'
    }
  }
}
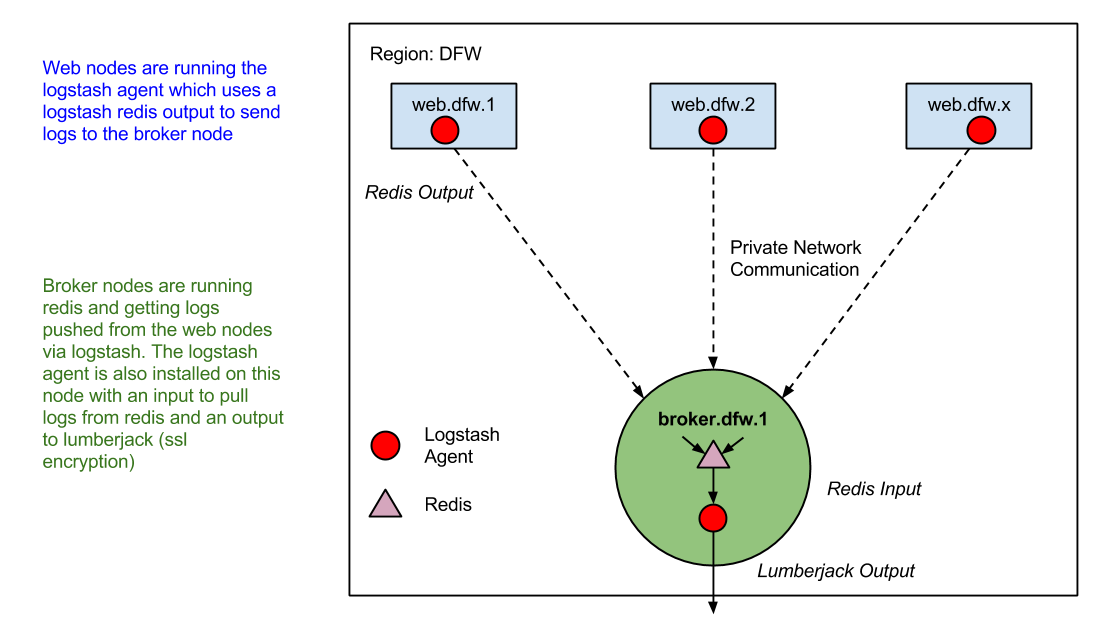
Basically what logstash would do is take all new events from the apache error and access logs, tag them with ‘broker’, and when logstash checks its outputs any events tagged with ‘broker’ would get sent to our broker node. This is useful for us since we use logstash for processing and forwarding metrics to statsd from our logs as well. At this point we now have nodes in our environment forwarding to their local broker node in their datacenter.
The next step is to forward our logs to the collector. To do this we create a different set of conf.d files for our logstash agent to run on the broker node. For this portion we were originally going to use stunnel to create an encrypted channel for the logs to be sent over to the collector, however, as I was reading about the different inputs and outputs supported by logstash I stumbled on lumberjack. Now, I actually had quite a few issues with understanding how lumberjack should be used in the context of logstash. What I see now is that it can either REPLACE the logstash agent as a log handler and forwarder or logstash can CREATE a lumberjack instance on the fly to send events as output or read events forwarded by lumberjack. In the first case, you would actually have to compile and build the lumberjack project and run the agent as a service. In the second case the logstash agent handles all of that and one should just use the inputs and outputs as normal.
91_forward_to_collector.conf

input {
  redis {
    'host' => '<%= node["logstash"]["broker_ip"] %>'
    'data_type' => 'list'
    'key' => 'logstash'
  }
}

output {
  lumberjack {
    'hosts' => ['<%= node["logstash"]["collector_ip"] %>']
    'port' => <%= node["logstash"]["forwarder"]["port"] %>
    'ssl_certificate' => '<%= node["selfsigned_ssl"]["directory"] %><%= node["selfsigned_ssl"]["ssl_cert"] %>'
  }
}
92_lumberjack_collector.conf

input {
  lumberjack {
    'host' => '127.0.0.1'
    'port' => <%= node["logstash"]["forwarder"]["port"] %>
    'ssl_certificate' => '<%= node["selfsigned_ssl"]["directory"] %><%= node["selfsigned_ssl"]["ssl_cert"] %>'
    'ssl_key' => '<%= node["selfsigned_ssl"]["directory"] %><%= node["selfsigned_ssl"]["ssl_key"] %>'
  }
}

output {
  redis {
    'host' => '127.0.0.1'
    'data_type' => 'list'
    'key' => 'logstash'
  }
}
Unfortunately I ran out of time during our hackweek due to other issues I had to look at outside of this project to get the implementation down 100% but this is the rough idea for how it would look. I hope to make a follow up post when we have fully implemented the desired architecture. For now, this documents some of the learnings I gained while working on this project for a few days.